|
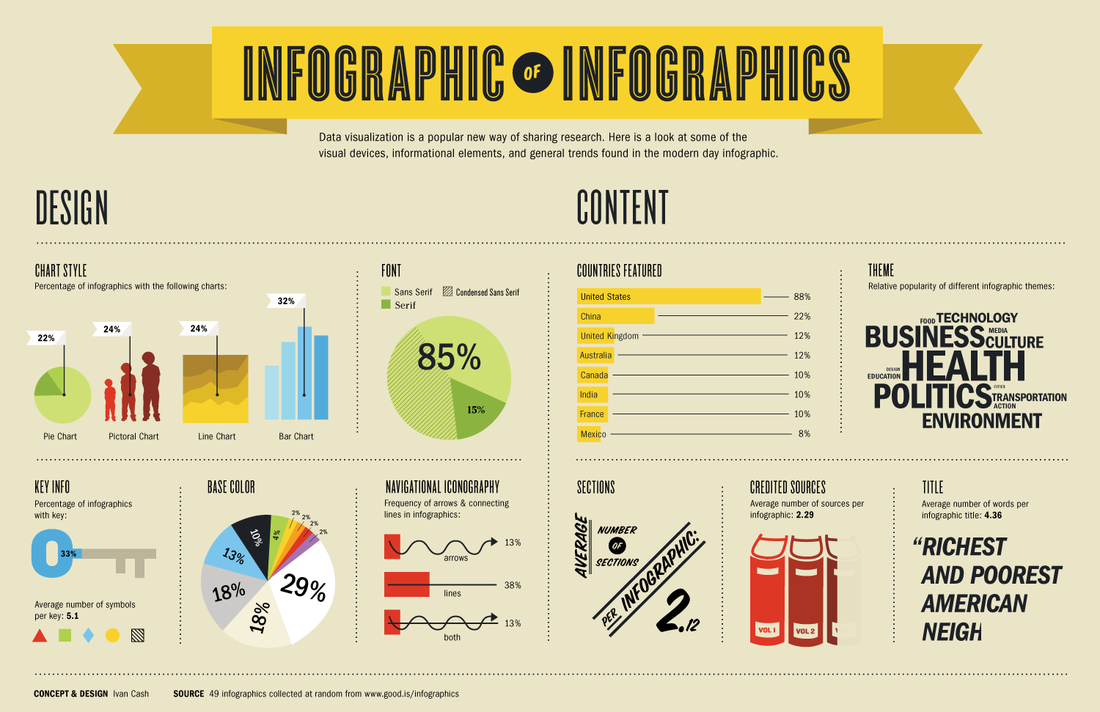
Infographics are so popular now that there’s a very meta infographic… on infographics. Check out this image by Ivan Cash for some statistics on their design and content.
0 Comments
It’s All About the Images [Infographic] http://www.mdgadvertising.com/blog/its-all-about-the-images-infographic/ Some say image is everything, and that’s especially true on the Internet where the shift to visual optimization is playing an increasingly important role in the recent phenomenon of photo marketing. In light of their numerous benefits for brands of all kinds, MDG Advertising developed an insightful infographic that illustrates the influence of images on a company’s business, branding, search, and social media efforts. For insight on optimizing images for content and commerce, along with advice on image optimization techniques, take a look at the infographic to see why images can help make success a snap. First, the infographic details the power of Pinterest whose popularity has propelled the use of high-quality images in sharable online content. It also explains how Facebook’s greater focus on images has led the social media giant to switch to Timeline and acquire photo startup Instagram. Next, the impact of images on articles is examined since content featuring compelling images averages 94 percent more total views than those without. It also illustrates how articles featuring news, political, and sports content appear to benefit the most from relevant images. In regard to press materials, the infographic shows that total online views are directly related to the number of multimedia elements within. A larger number of photos, videos, and other media accompanying press releases result in higher views. Local search is also discovering the positive impact of images, with 60 percent of consumers more inclined to select a business with images in its local listing. This illustrates the strong relationship between image and photo SEO, which businesses can no longer afford to ignore as more and more companies realize the attention-grabbing power of images in local search. The infographic goes on to explain why high-quality images are essential to e-commerce. Clear, detailed images are deemed to be very important by 67 percent of consumers and carry even more weight than the product information, full description, and customer ratings. Finally, the correlation between images and social media is examined and it’s no surprise that posts with photos have higher levels of social engagement than other types of posts. Advice on optimizing images for social media is also featured. As MDG’s infographic shows, images are the rising stars of the Internet and harnessing the enormous power of image optimization in a company’s photo marketing strategy can result in unlimited potential and performance for an image-savvy business. A market where consumers are the main media. Let’s face it; the traditional cell phone is being overtaken by the far more capable smartphone. Equipped with high-speed internet connections and lightning fast processors, these devices have essentially put fully capable, interactive billboards in our pockets for marketers to experiment with. How are advertisers taking advantage of this huge potential, and are consumers paying attention? Below we explore the burgeoning world of mobile marketing. On the heels of Google’s “disappointing” earnings announcement last Thursday – they generated a whopping $37.9 billion in revenues in 2011 – we conducted our own analysis to determine the top 10 industries that spent the most money on Google advertising last year. The results are summarized in this Google revenues infographic. When you hear the word ‘geek,’ an image of a nerd with tapped glasses and a pocket protector instantly comes to mind. This infographic shows the evolution of the geek from super nerd to super chic. These days it’s cool to be geeky, whether you’re a film geek, tech geek or book geek. While there are still different levels of geekdom – one thing is for certain – geeks rule the world. |
Categories
All
|
| Web Developer Tools |
|
- Home
-
Web Developer Tools
-
SEO
- Free SERP Position Checker
- Check Google PageRank
- Search Engine Optimization Videos
- Keyword Research for SEO
- How to Use Social Bookmarking Sites To Increase SEO
- Social Bookmarking Sites for SEO
- Website SEO Evaluations
- SEO Evaluators >
- Social Sharing Toolbars
- SEO Infographics
- Google's Algorithm Change History
- SEM
-
Directory
- Extras
- About DeveloperNotes
- Sites I Recommend


 RSS Feed
